Stockchart Patterns
Stockchart Patterns: Head and Shoulders
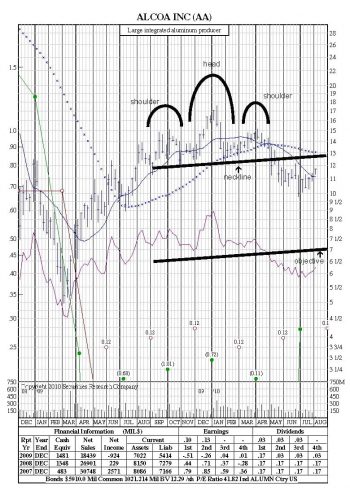
Perhaps one of the most famous of the technical indicators – the head and shoulders pattern – is said to indicate a sharp price decline, a bearish pattern. Presumably, one can notice the pattern early enough to allow selling during the right shoulder rally if one has missed the head top. Obviously, the pattern is easiest to detect in hindsight.
In the chart below, Alcoa appears to have formed a bearish head & shoulders top pattern with a break below neckline support at $12.50 in May. The pattern has a downside objective of $7. A break back above the neckline (now acting as resistance) would negate the pattern before reaching its objective, whereas failure to break above the neckline would further support the formation of the pattern.

Stockchart Patterns: Cup and Handle
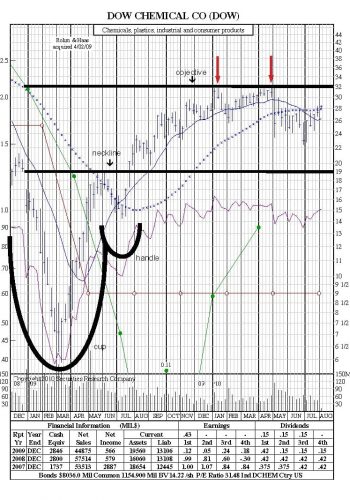
A cup-and-handle pattern resembles the shape of a tea cup on a chart. This is a bullish pattern where the upward trend has paused, and traded down, but will continue in an upward direction upon the completion of the pattern. This pattern can range from several months to a year, but its general form remains the same.
In the chart below, DOW provides an example of a bullish cup & handle pattern that fully formed and played out. It broke above neckline resistance at $19 (July ‘09), reached its actual pattern objective of
$32, and tested it twice before pulling back (Jan ’10, April ‘10).

Stockchart Patterns: Fibonacci Retracement
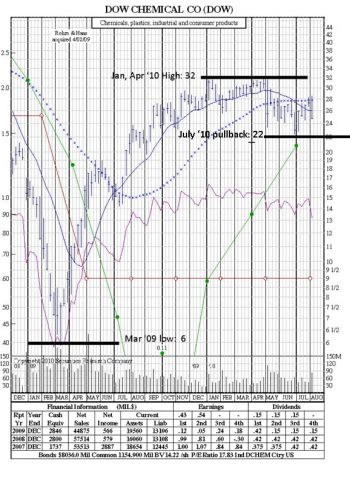
Fibonacci retracement is based on the key numbers identified by mathematician Leonardo Fibonacci in the 13th century. However, Fibonacci’s sequence of numbers is not as important as the mathematical relationships, expressed as ratios, between the numbers in the series. In technical analysis, Fibonacci retracement is created by taking two extreme points (a peak and low point) on a stock chart and dividing the vertical distance by the key Fibonacci ratios of 23.6%, 38.2%, 50%, 61.8% and 100%. Once these levels are identified, horizontal lines are drawn and used to identify possible support and resistance levels.
In the chart below, DOW went from a Mar ‘09 low of 6 to an April ’10 high of 32, a move of 26. It then pulled back to 22 in July ‘10, a move of 10. 10/26 = 38.4% retracement. Key Fibonacci retracements are 38.2%, 50% and 61.8%. Stocks will often pull back to a Fibonacci retracement level just before resuming their current trend.

