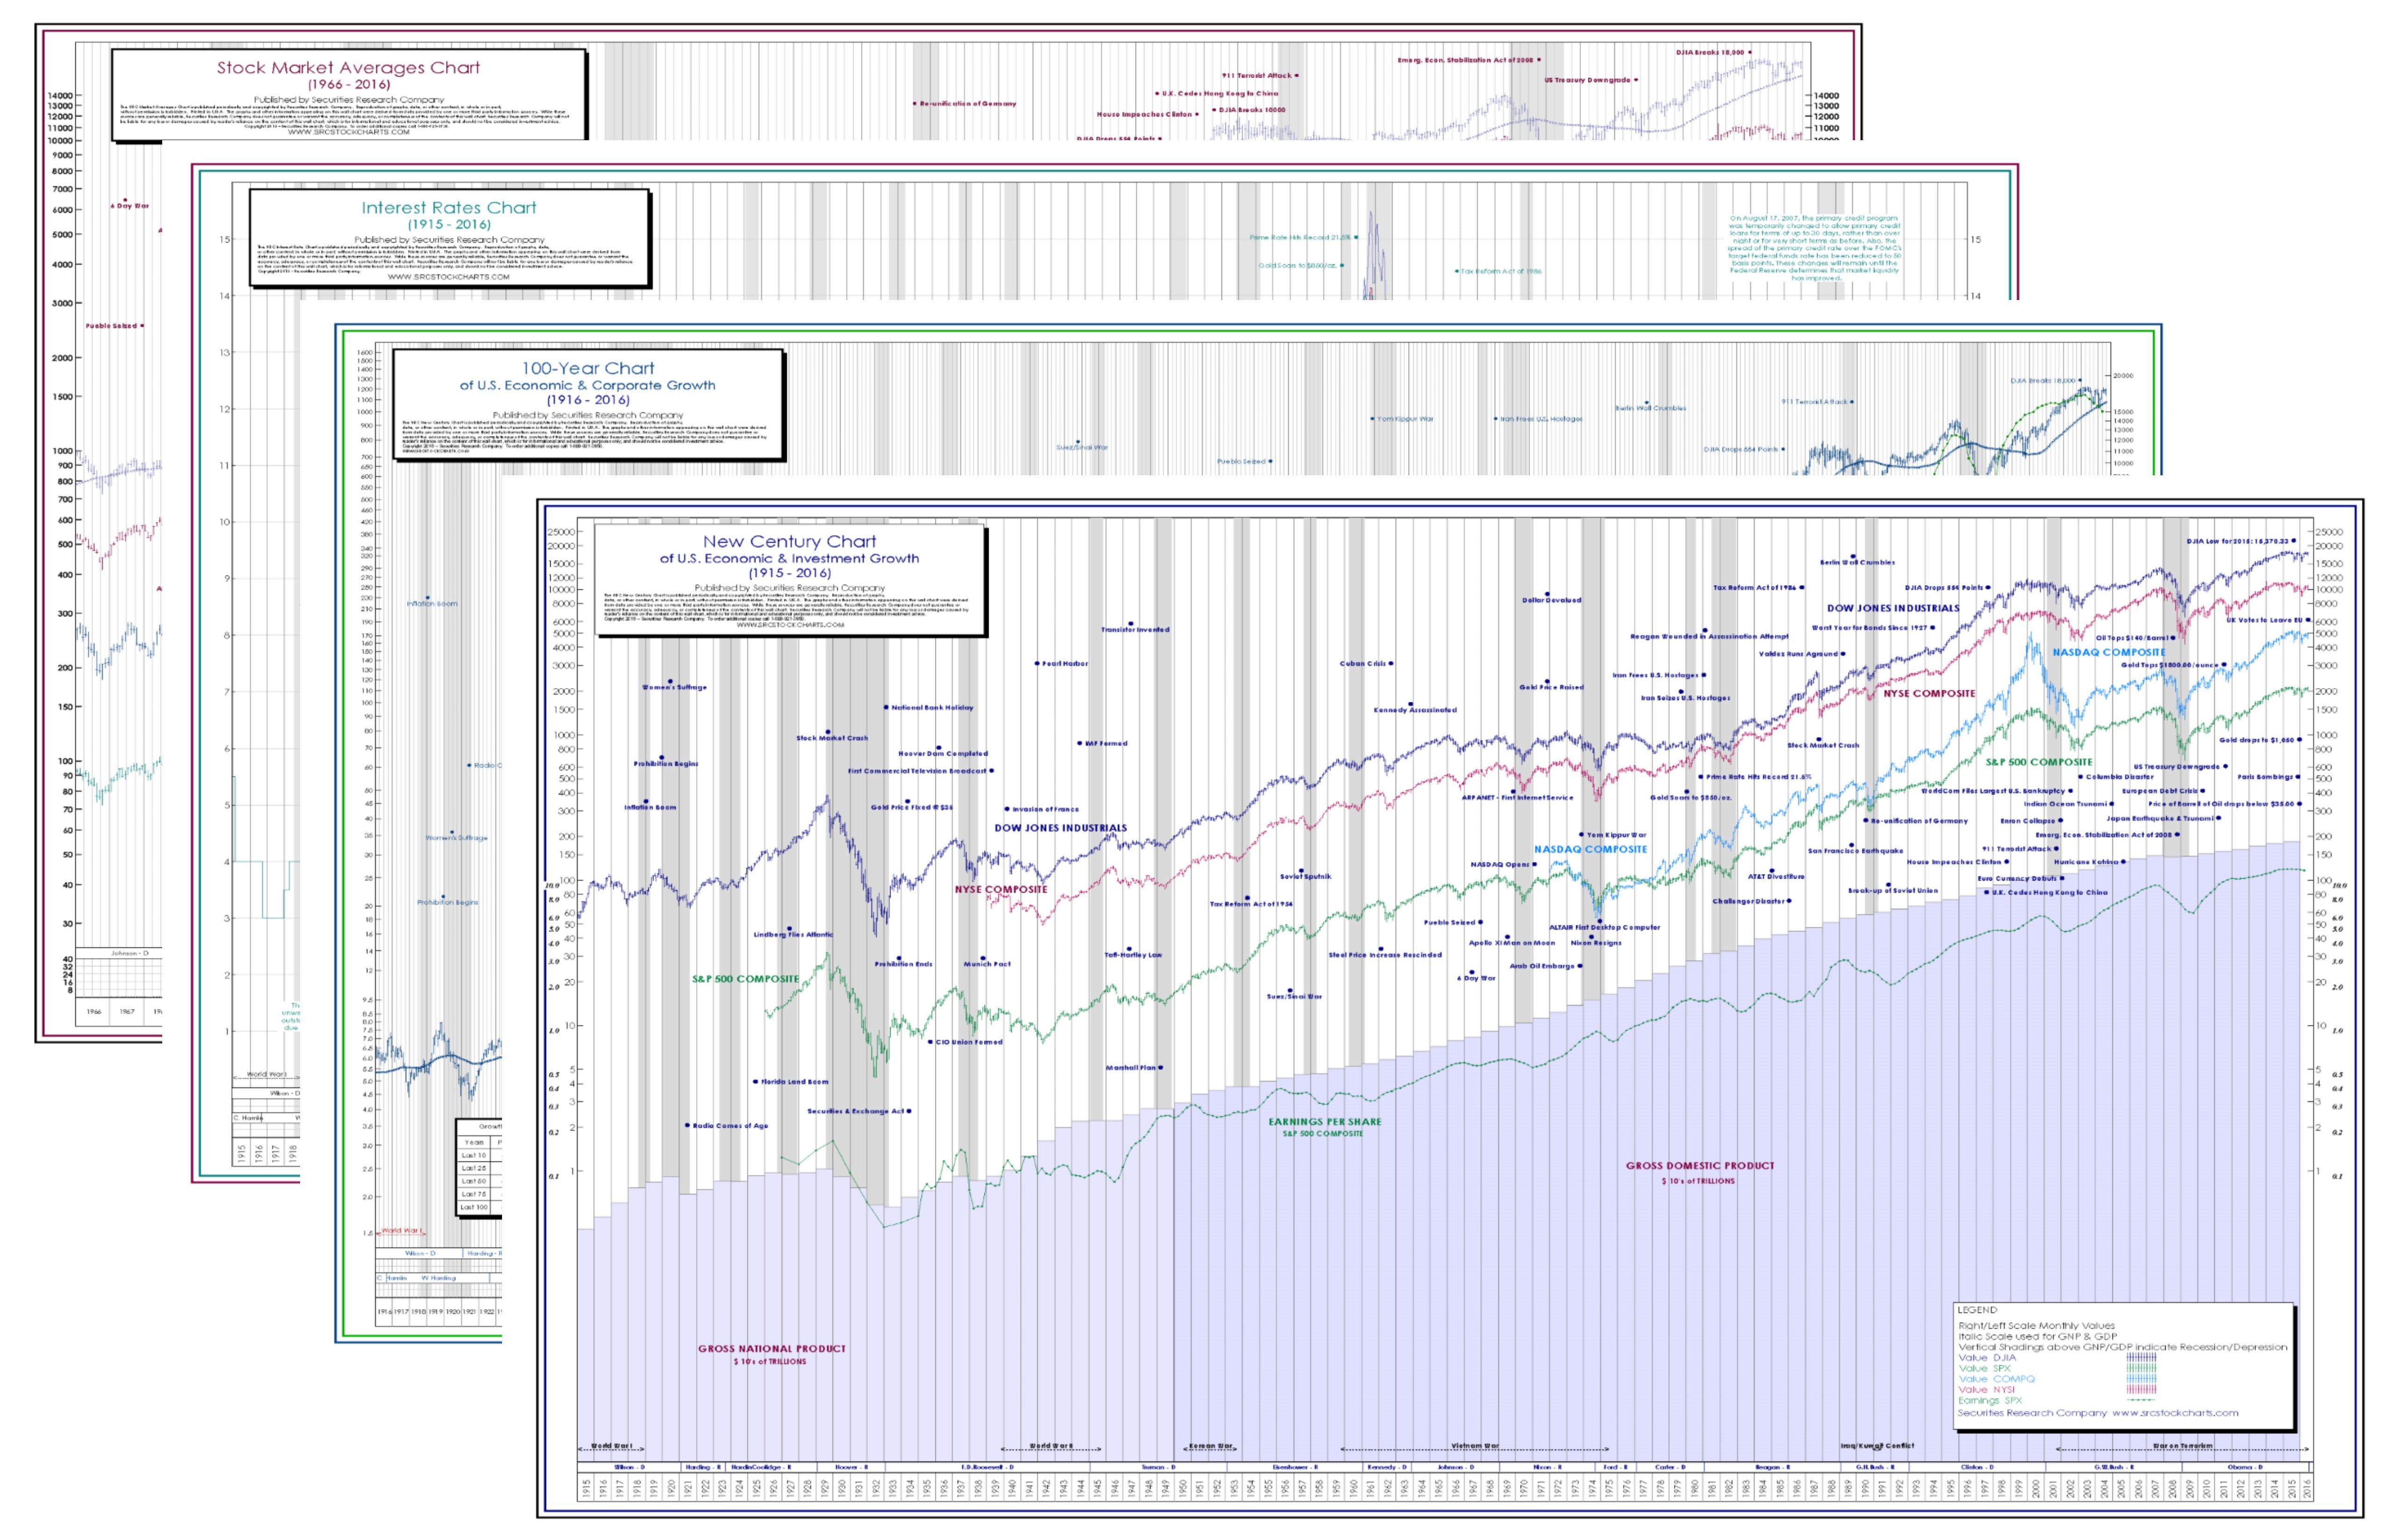
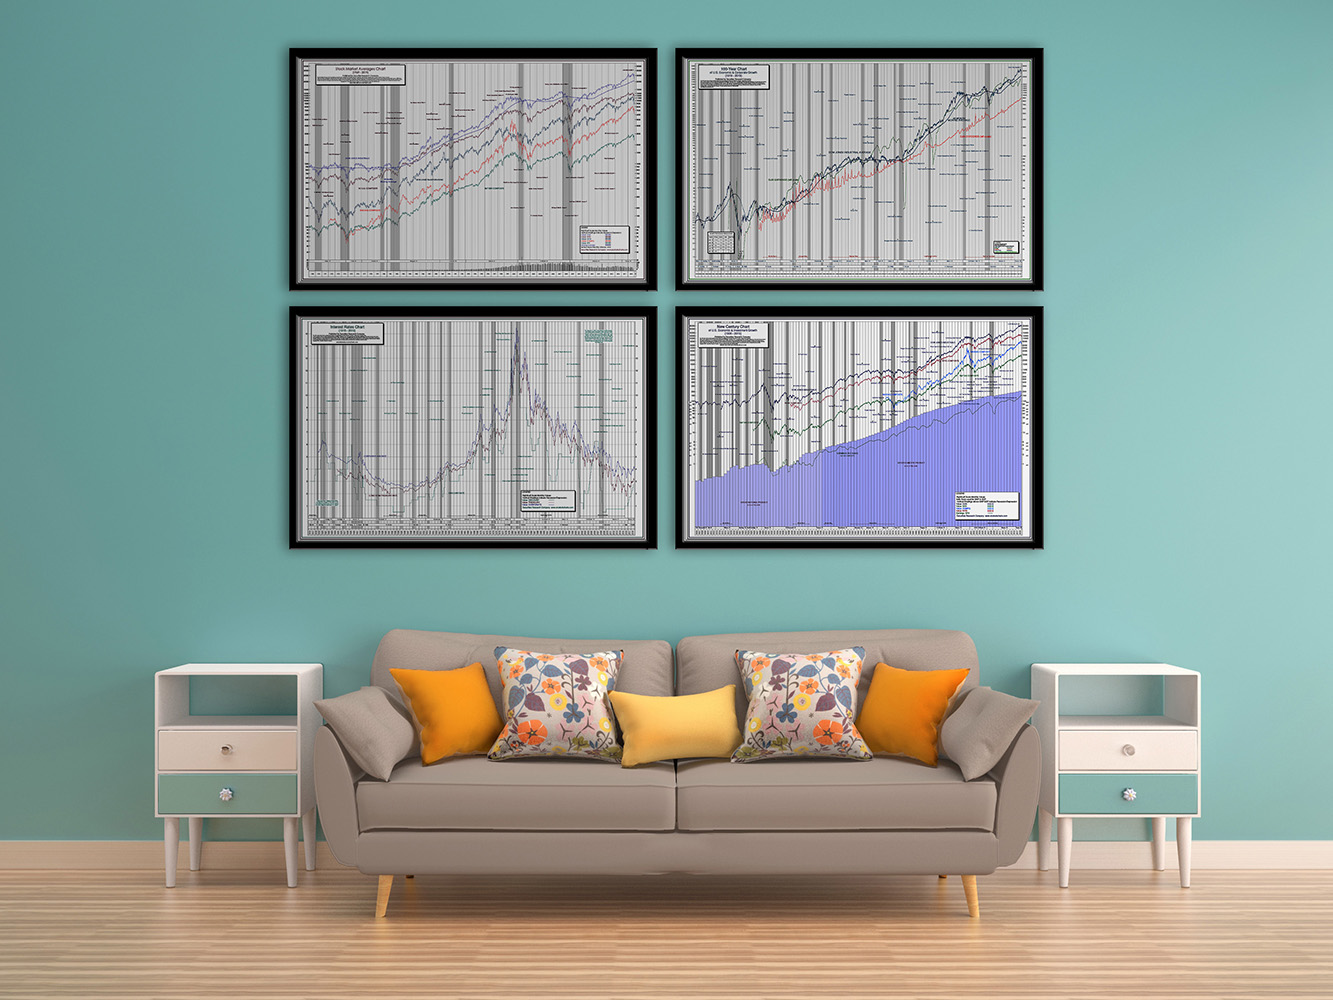
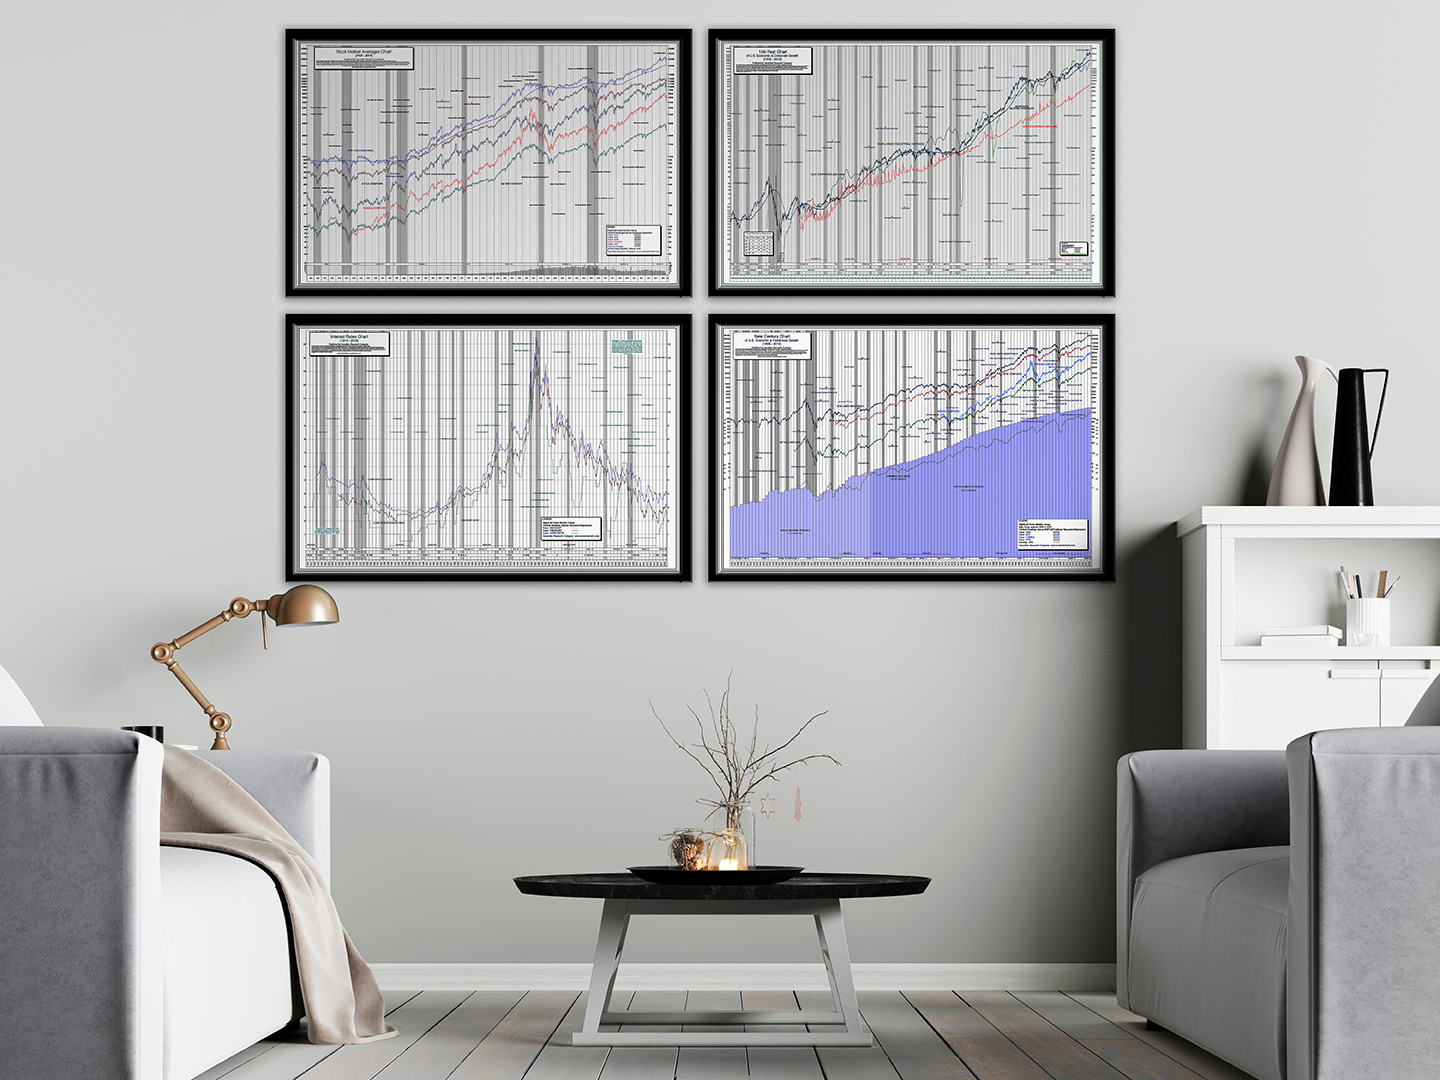
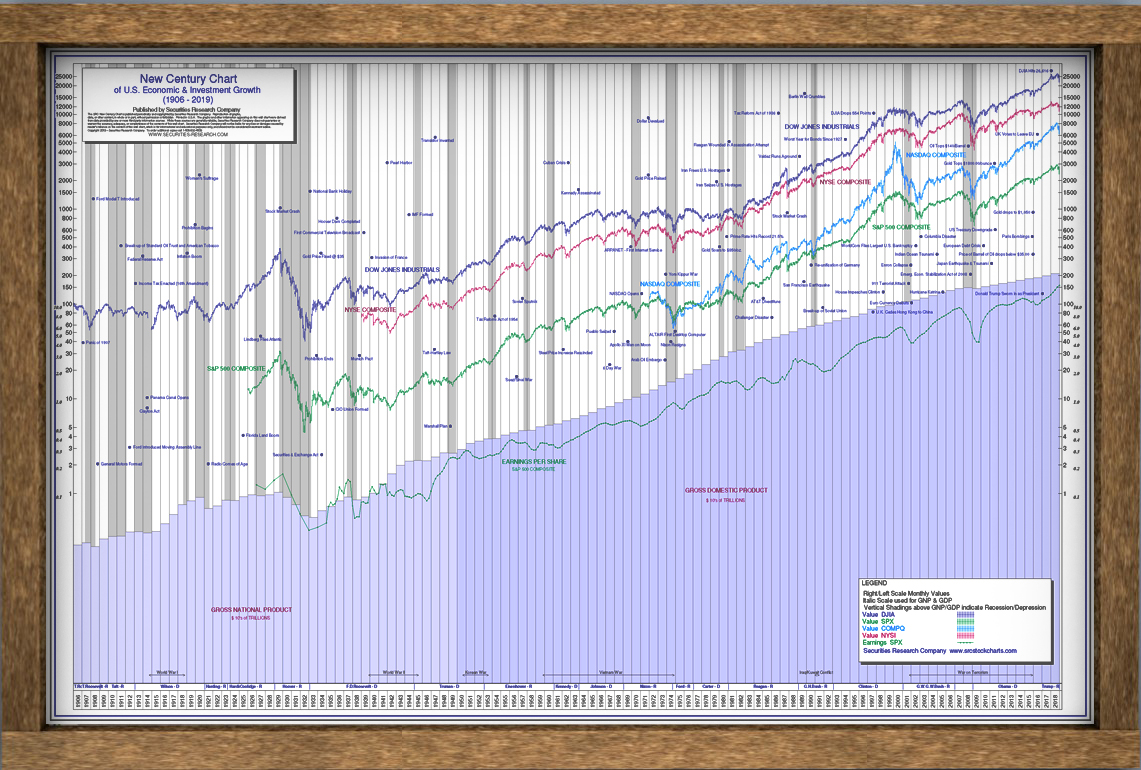
Description
SRC’s Stock Market Chart Posters are Encyclopedias At-A-Glance
Perfect for the Office • Boardroom • Lobby • Classroom • Home Office
Full-color for high visibility and readability. Recessionary periods – geopolitical events – presidential terms are highlighted.
Wall Chart Size (24″ x 36″) Perfect for Framing (uses a standard poster frame)
You can also Customize with your Organization’s Logo or Message!
Save when you order all Four Stock Market Chart Posters – the most popular option!
Receive one of each of the Stock Market Chart Posters on this page. Charts are available in WALL CHART size (24″x 36″) and are perfect for framing and hanging in your office, boardroom, home office or classroom.
Charts updated through April 1, 2025
You can also customize the Charts with your organization’s logo message for just $49. Bulk quantity pricing is available. For more information call us at 1(800)921-3950.
- 100+ years of data
- Indicators: Dow Jones Industrials, S&P Composite, NASDAQ Composite, NYSE Composite, S&P Earnings Per Share, Gross Domestic Product
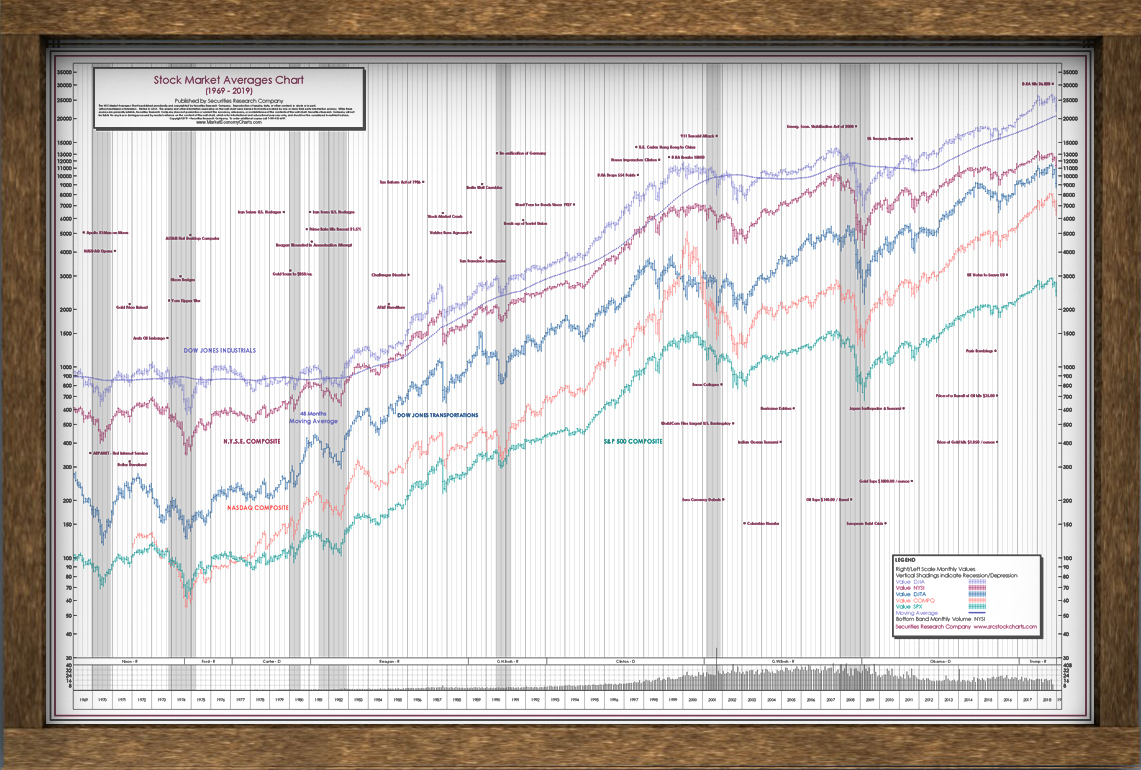
- 50 years of data
- Semi-Logarithmic Scale
- Indicators: Dow Jones Industrials, NYSE Composite, Dow Jones Transportations, NASDAQ, S&P 500, Dow Jones Utilities
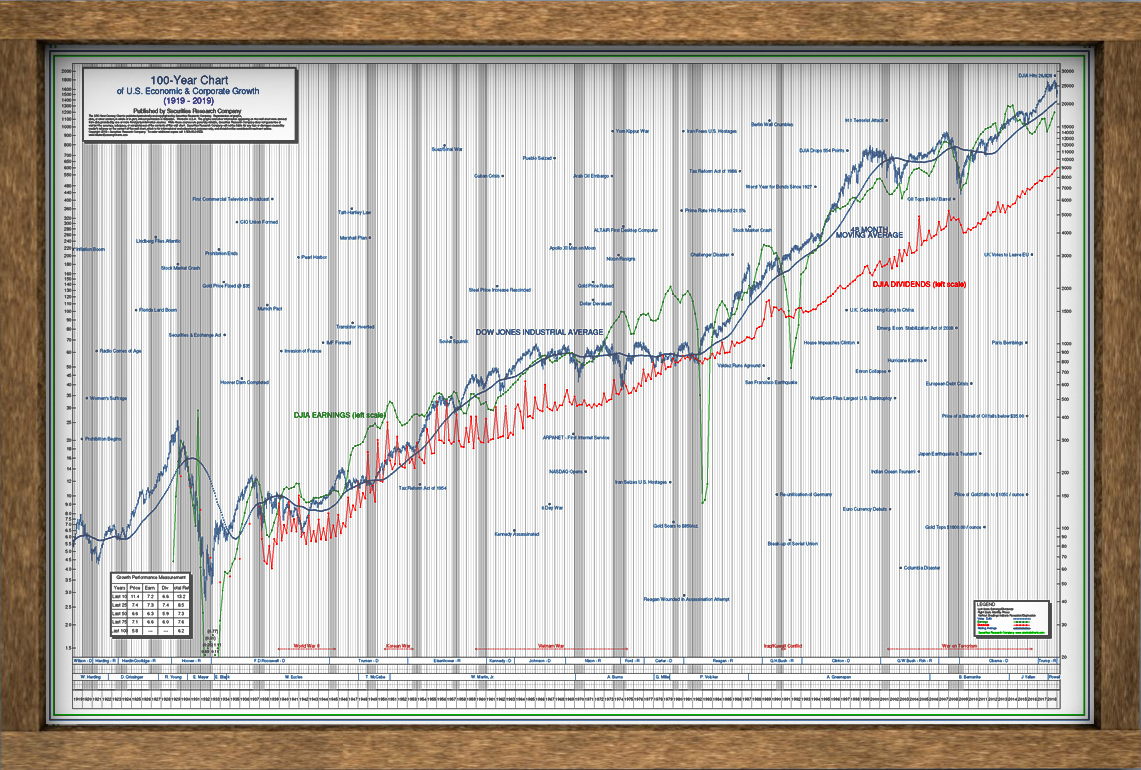
The 100-Year Chart of U.S. Corporate and Economic Growth – Featuring the DJIA.
- Indicators: Dow Jones Industrial Average Prices, Dow Jones Industrial Average, Earnings Per Share,Dow Jones Industrial Average Dividend, Real Gross Domestic Product
- DJIA Price, Earnings & Dividend Growth Rates for the past 10, 25, 50, 75 & 100 Years
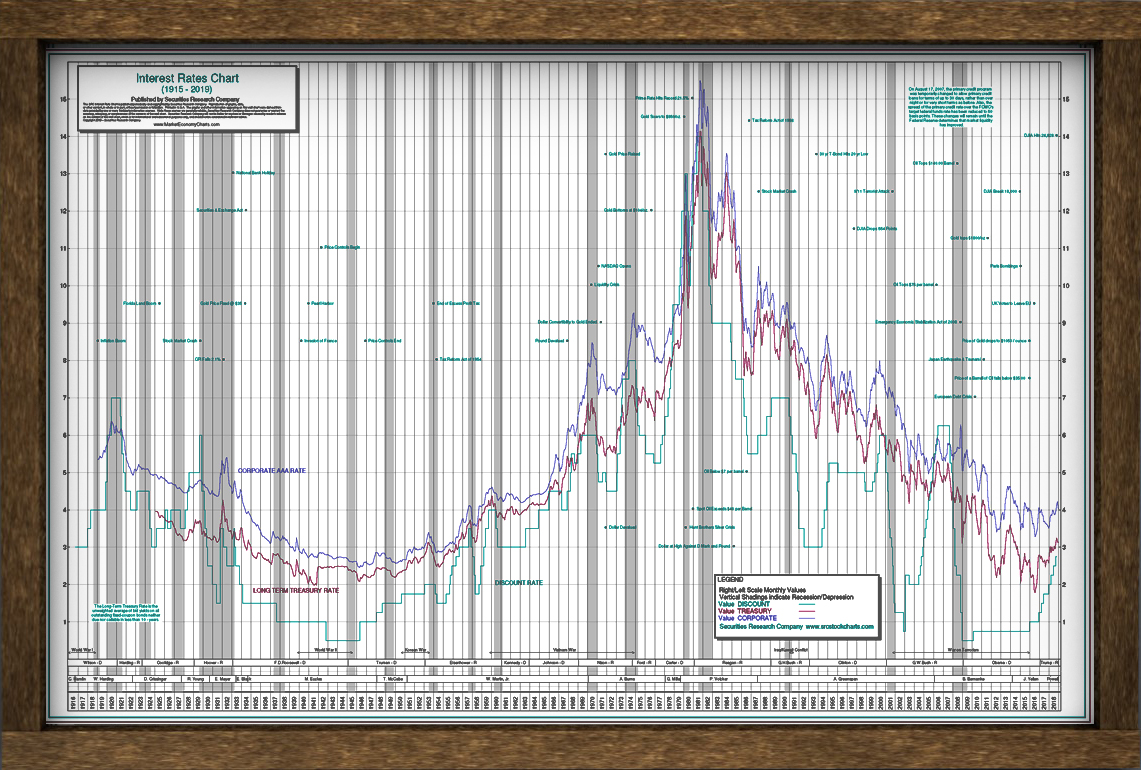
The Interest Rate Chart – Since 1915.
- Indicators: Term Treasury Composite, Discount Rate and Corporate AAA Rate
- Federal Reserve Chairman


