Description
Key fundamental equity data every investor needs
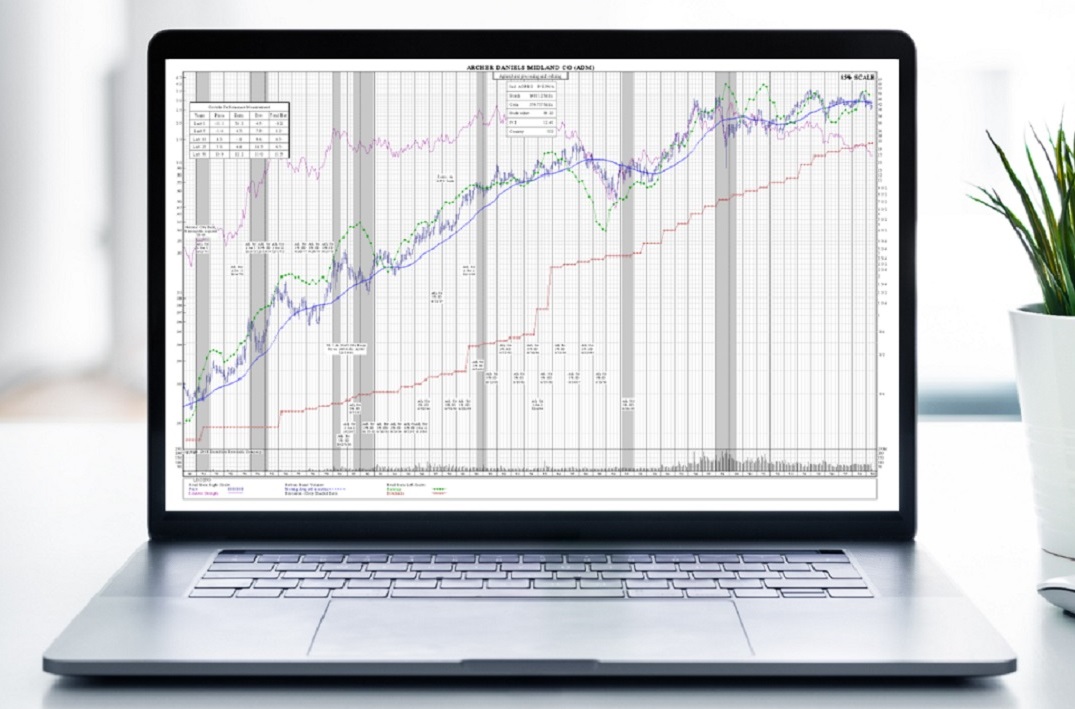
SRC has a one of kind, comprehensive database of stock fundamentals going back to its inception in 1933. Each SRC Equity Chart graphically traces the monthly price ranges, relative-to-market performance, moving average, trading volumes, plus earnings adjusted for extraordinary items, dividends. In addition all data has been fully adjusted for stock splits and dividends. Key events in the company’s history are also noted. You can also create up to 25 portfolios. Each online equity chart is updated nightly, full-color and presentation-quality!
Screens & filters to help you find the right stocks fast.
With ChartScreen, all charts are updated each day, plus you can use SRC’s powerful search & filtering functions to help you quickly find the stocks that fit your investing criteria. Filters include: Exchanges • Industries • Sectors • P/E Ratio • P/G Ratio • PEG/PEGY Ratio • Price Growth • Dividend Yield • Earnings Growth • New 52 Week Close (High/Low) • Volume (20 day average) • Earnings Stability (R2) • Revenue Growth, and Market Capitalization.
ChartScreen Annual Subscription Options
Your subscription is for one full year – and you can select from any of the following:
Features
Each stock chart graphically traces the monthly price ranges, relative-to-market performance, 48-month moving average, trading volumes, plus earnings and dividends. In addition, all data has been fully adjusted for stock splits and dividends. Key events in the company’s history are noted. Recessionary periods are shaded grey.
- Capitalization figures shown at the bottom of each chart are based upon the company’s latest annual report.
- Monthly Price Ranges are read from the right scale. They represent the highest and lowest point reached. The horizontal cross bar indicated the last trade or closing price.
- Adjusted Earnings are read from the left scale and have extraordinary items removed such as discontinued operations, restructuring charge tax benefit, non-recurring charges, investment gains & losses, giving you the clearest earnings performance possible.
- Dividends are read from the left scale and are plotted on an annual basis. Dividends above or below the charts as well as specials, extras, irregular payments, etc. are noted.
- Relative Performance Line is read from the right scale. This line indicates whether the stock is outperforming, lagging or keeping pace with the general market as represented by the S&P 500.
- The Moving Average is plotted monthly and read from the right scale. This represents the average of the closing prices for the most recent 48 month period.
- Volume is plotted on an arithmetic scale at the bottom of each chart. The vertical bars indicate the number of shares traded each month. Thousands are indicated by a T at the top right of the volume scale, millions by an M and billions by a B.
- Growth Performance Measurement (GPM) is being provided in a block that appears in the top left corner of the company chart. The percent gain or loss for price, earnings, and dividends is shown for specific time periods as indicated by the number of years shown. The figures presented are average annual compounded percent return.
- Key Notations – Significant events in a company’s history, such as an acquisition, divestiture or stock split are indicated on the chart.
- Semi-logarithmic scale – Our stock charts are plotted on uniform semi-log grids. This enables you to quickly compare percentage moves on one stock chart with any other.

