Historical Stock Charts
SRC’s historical stock charts are created from our 100-year historical stock data focusing on the performance of key fundamentals, while most stock chart providers have only 15-20 years of stock data. And, unlike others, SRC has no gaps in earnings adjusted for splits. As a result, SRC is the only stock research and publisher of historical stock data and charts that provide a complete and accurate historical perspective of a stock’s performance – and is considered by many to be the “gold-standard” in the industry.
Today’s market volatility is keeping investors on edge. Stock valuations have exceeded their historic P/E ratios as witnessed by SRC’s historical stock charts – and many analysts predict continued market volatility given the uncertainties of the political and economic climate .
The best way to protect your investments – and gain insight to buying opportunities – is to have a thorough understanding of a stock’s fundamentals over time. And that’s where SRC comes in.
Only SRC’s long-term research provides those answers by giving you the clearest picture of how 2,200 stocks performed in previously volatile markets, and what your potential upside or risk may be.
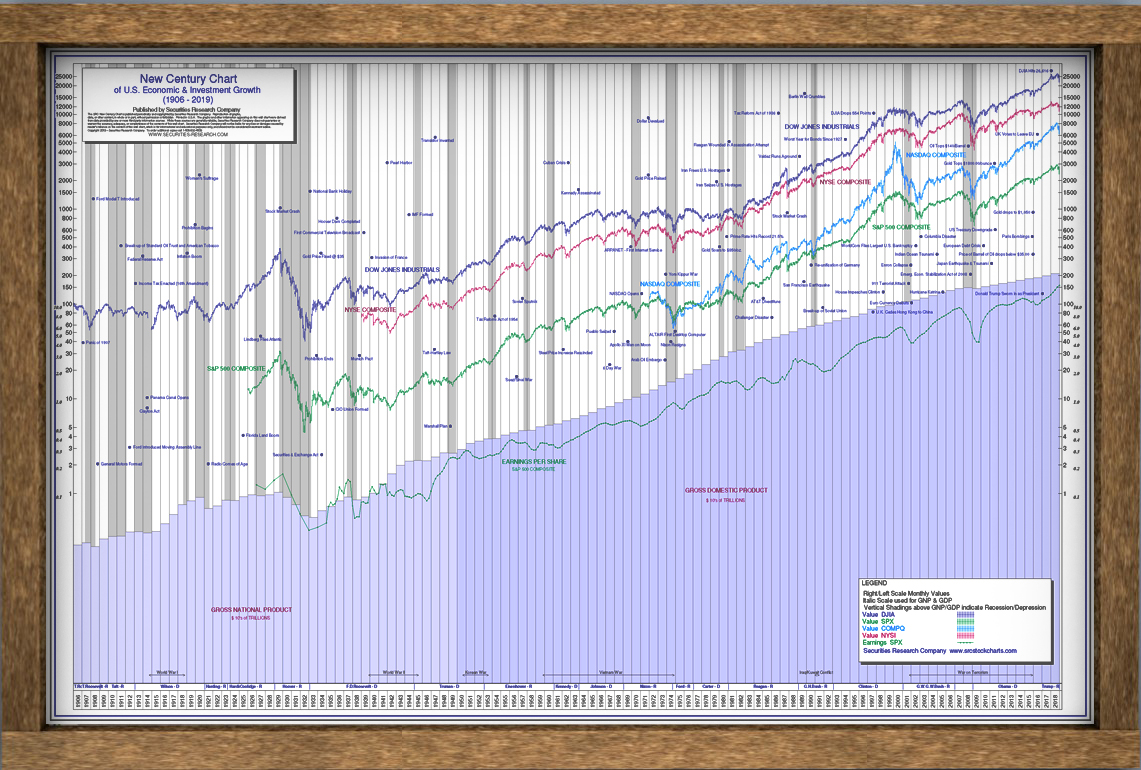
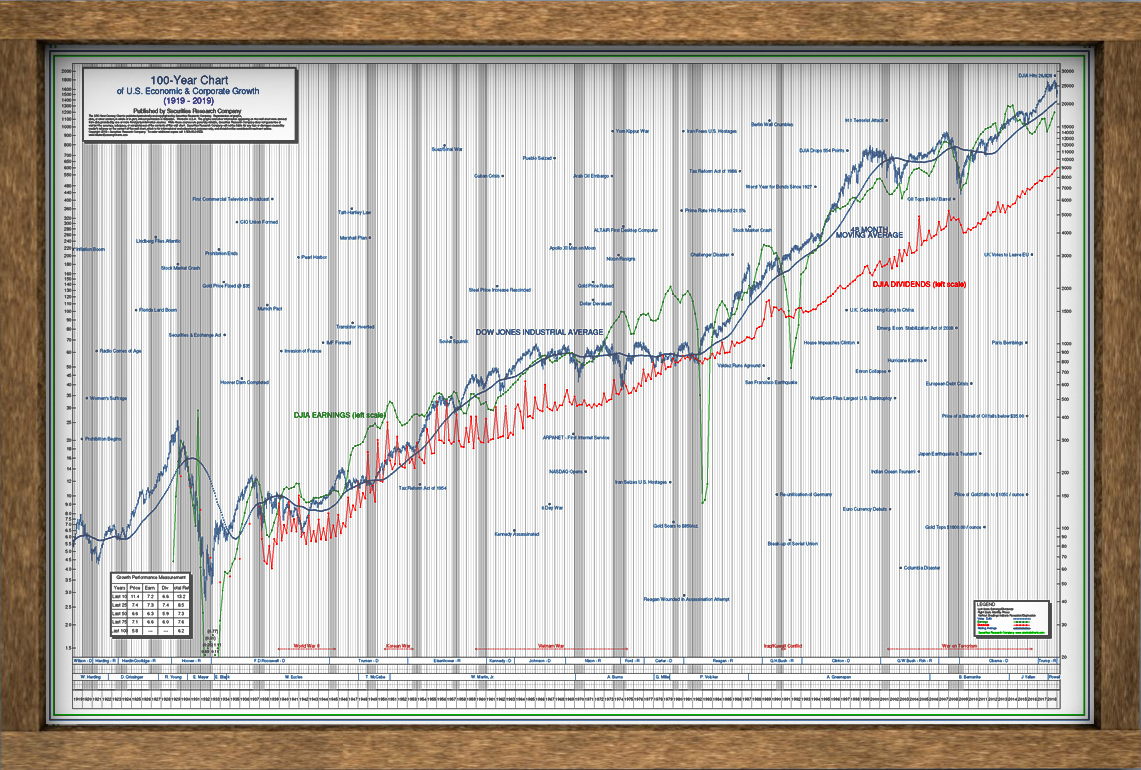
At-a-glance, you can scan SRC’s historical stock charts with underlying fundamental performance going as far back as 1906, and see the correlation of earnings (adjusted for extraordinary items), dividends, and other key fundamental data to help you – and your clients – make the most informed decisions.
Why does this history matter? Like life, many stocks have a history that repeats itself. And by examining SRC’s historical stock charts you can quickly see price and earnings patterns emerge that are characteristic of that stock, during different market conditions.
Historical Stock Charts - Click to Download all Dow Jones Companies Stock Charts
The FREE Dow Jones Historical Stock Chart for each Dow Jones Industrial Average Company include the following:
Apple (AAPL), American Express (AXP), Boeing (BA), Caterpillar (CAT), Cisco Systems (CSCO), Chevron Corporation (CVX), DowDuPont (DWDP), Walt Disney (DIS), General Electric (GE), Goldman Sachs (GS), The Home Depot (HD), IBM (IBM), Intel (INTC), Johnson & Johnson (JNJ), JPMorgan Chase (JPM), Coca-Cola (KO), McDonald’s (MCD), 3M (MMM), Merck (MRK), Microsoft (MSFT), Nike (NKE), Pfizer (PFE), Procter & Gamble (PG), Travelers (TRV), United Technologies Corporation (UTX), Verizon Communications (VZ), Visa (V), Walgreens Boot Alliance (WBA), Wal-Mart (WMT), ExxonMobil (XOM)
Just click on each link or image below to download the FREE Historical Stock Chart each Dow Jones Industrial Average Company for all stocks listed above.
Historical Stockchart Posters & Historical Stock Market & Economic Posters
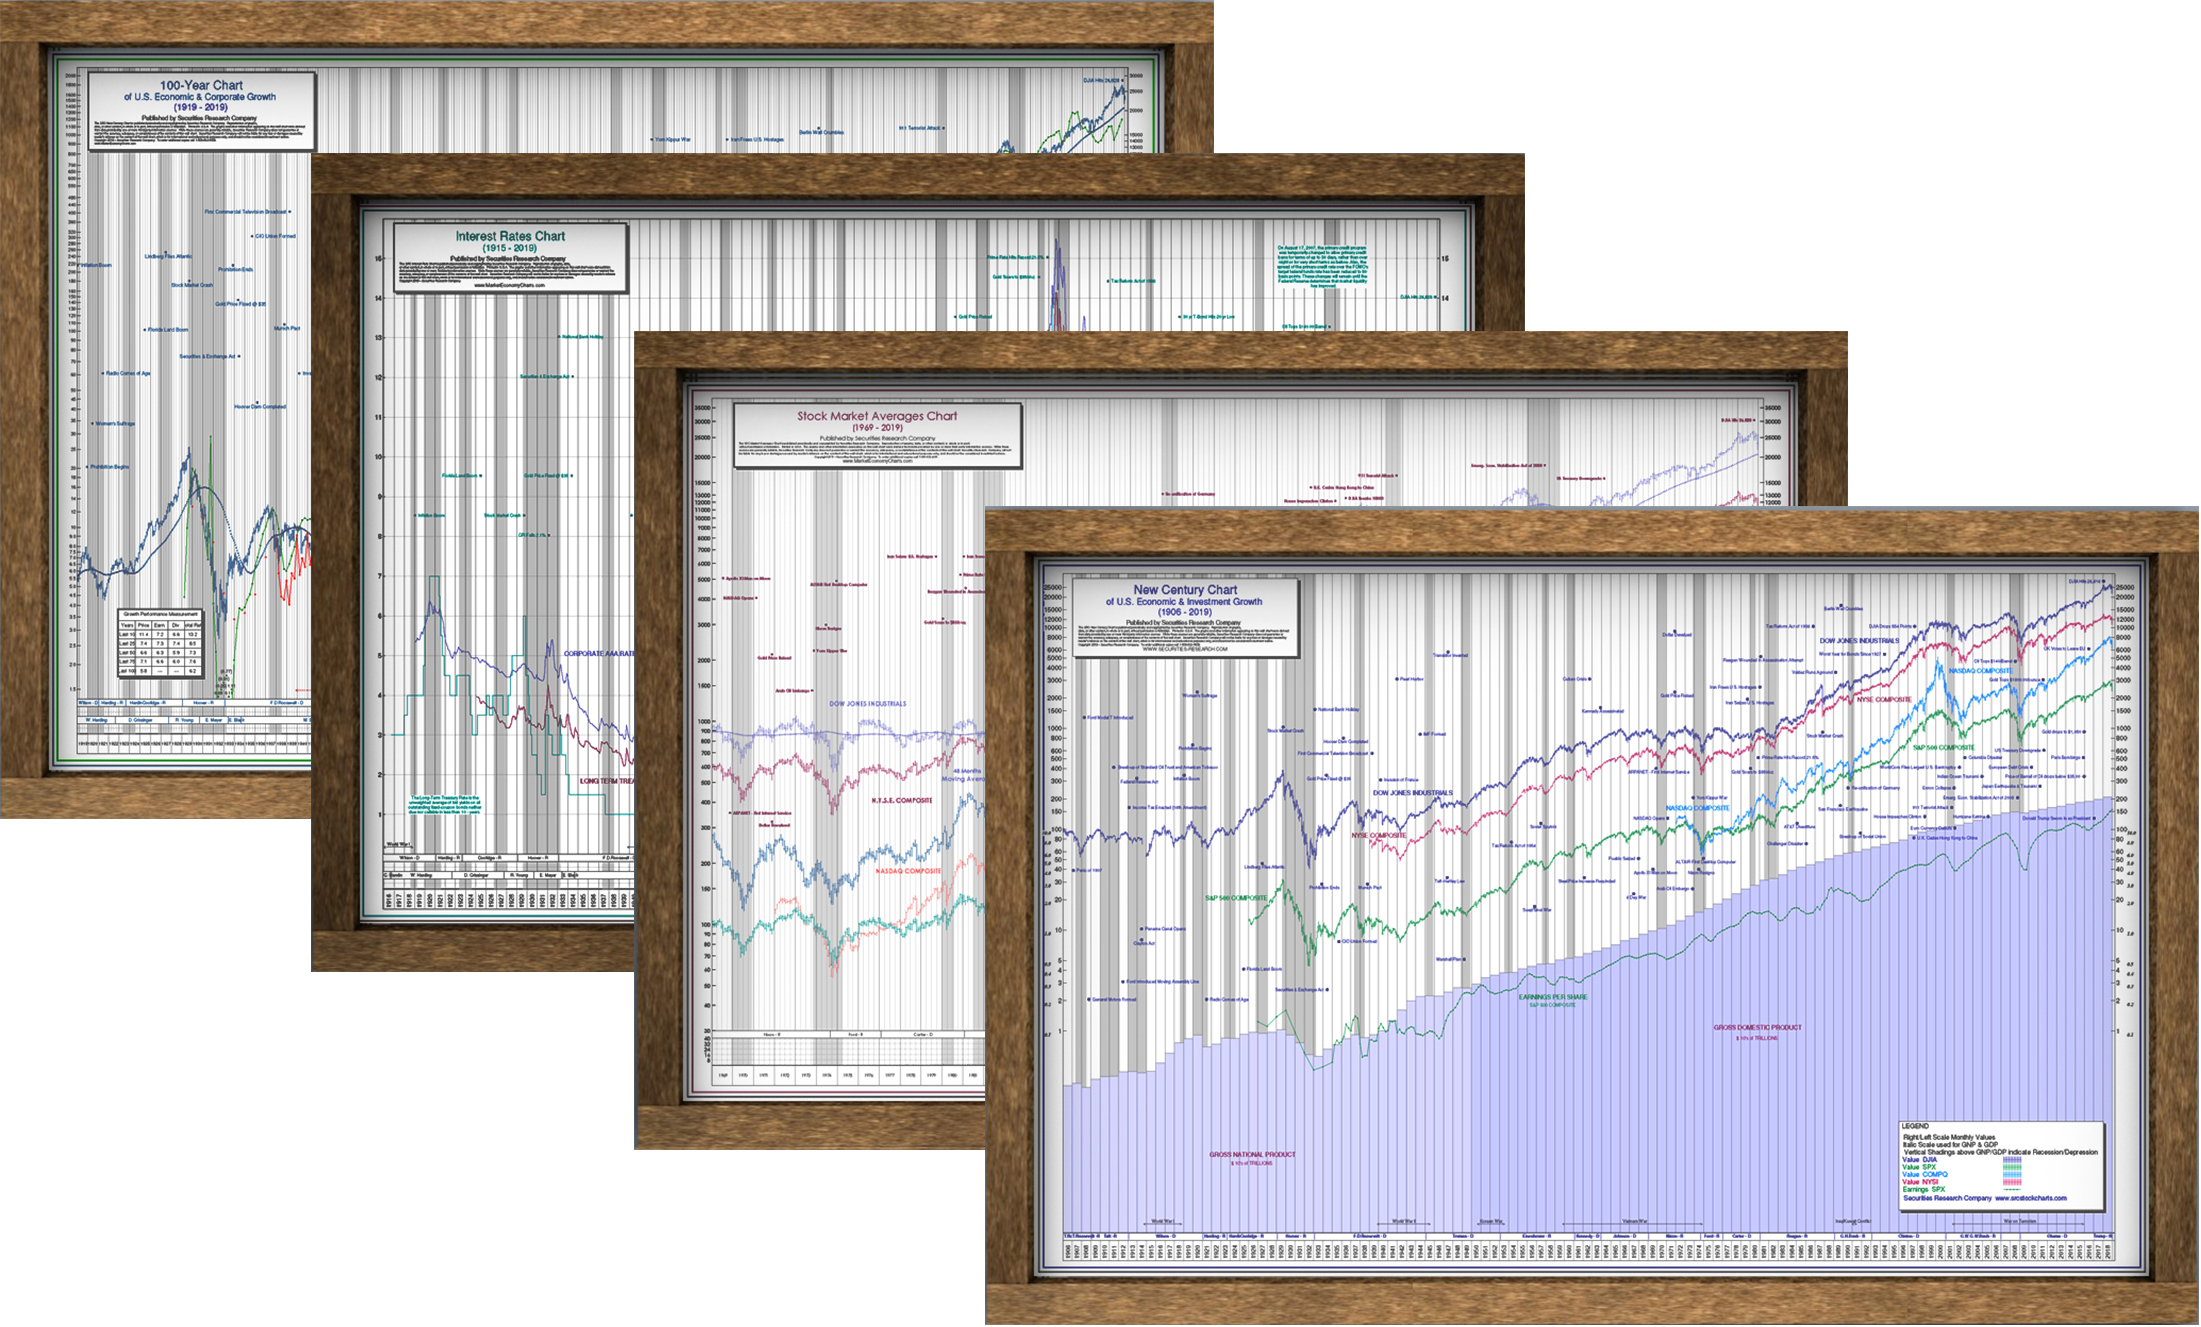
The SRC Economic & Historical Stock Market Posters are the most useful and accurate wall charts available. Also the interest rate and economic indicator stock market posters are the perfect way to see long-term trends, cycles, and patterns in large, graphical poster formats. Indispensable tool for board rooms, offices, meetings and the classroom.
Each full chart is 24″ x 36″ for easy framing. Data updated through December 31, 2019.
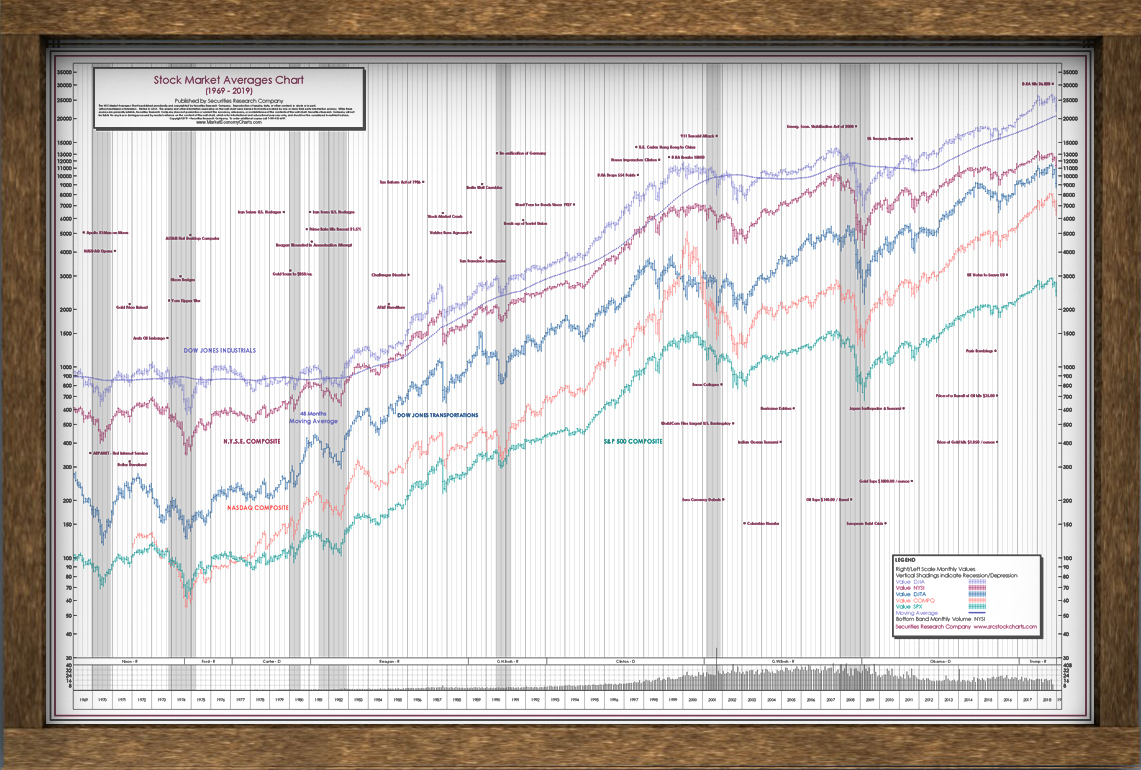
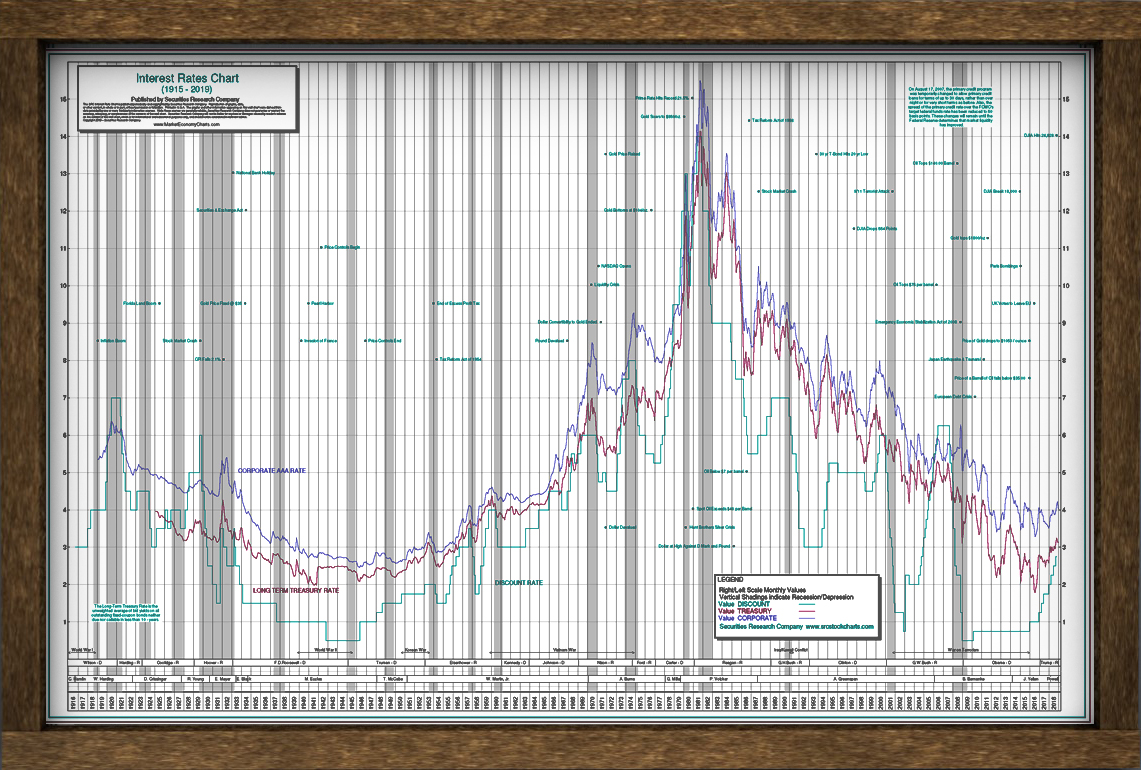
Featuring the Historical Dow Jones Century Chart, the Historical DJIA Chart including DJIA Fundamentals, The 50-Year Historical Stock Chart with several Indices, and the Historical Interest Rate Chart.
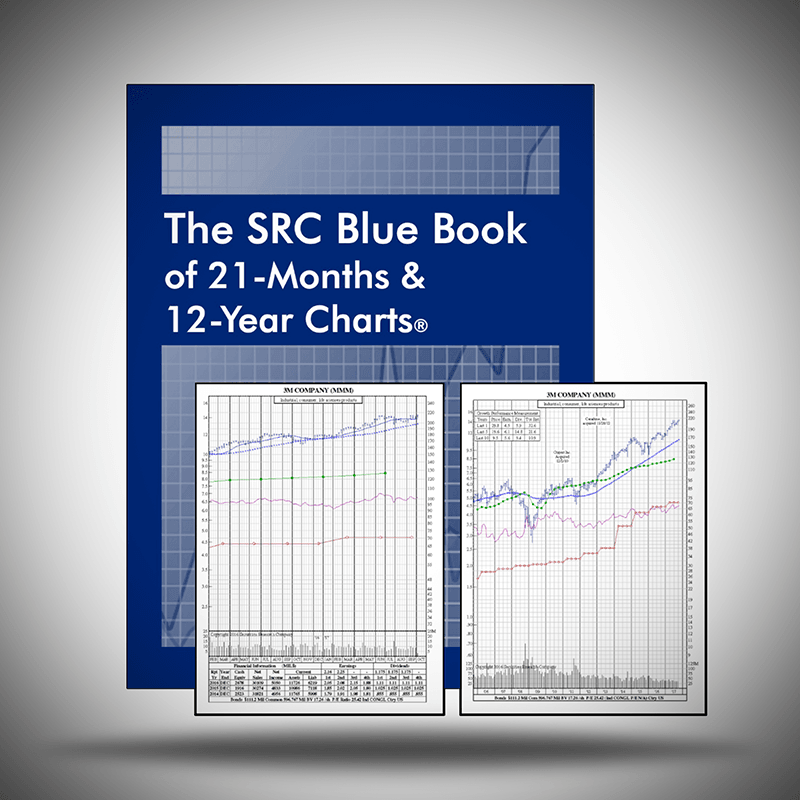
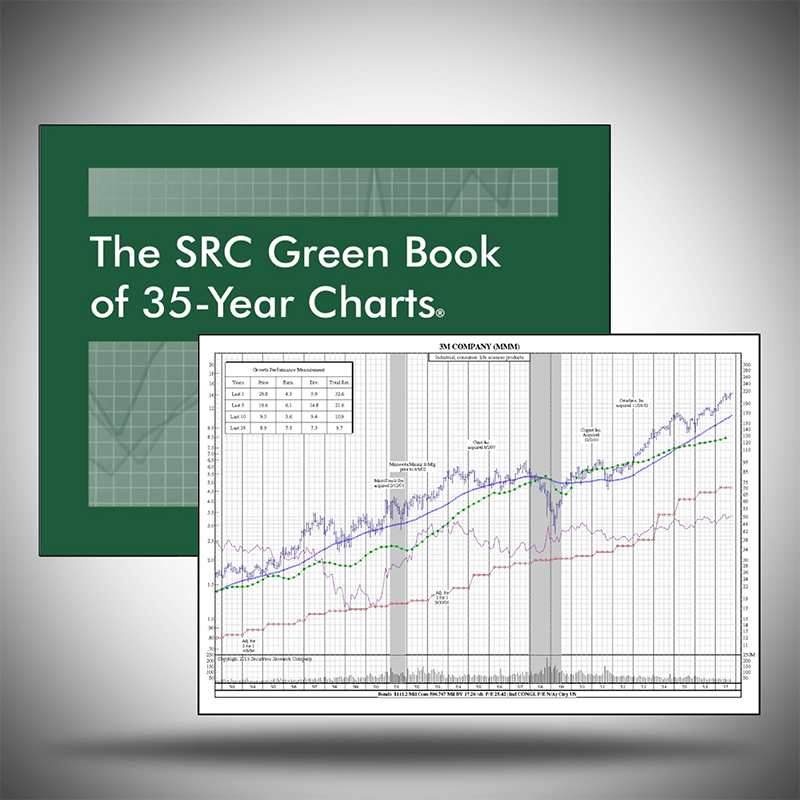
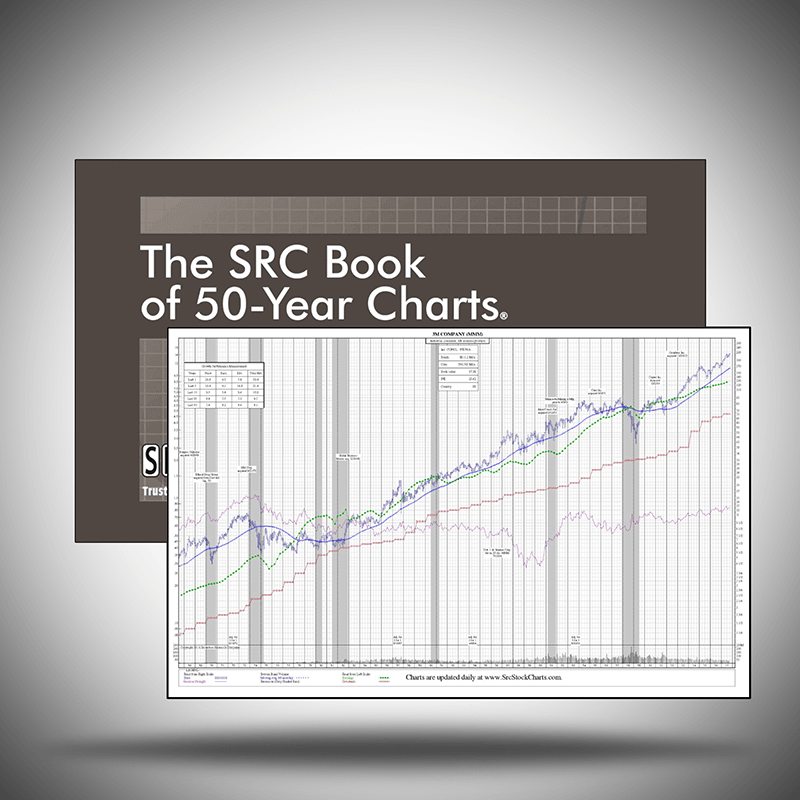
Iconic. SRC's Stock Chart Books & Optional Online Services.
A trusted resource for both professional and individual investors since 1933. Perfect for your own research or a useful tool to providing independent research for your clients. SRC’s Stock Chart Books span 21-Months to 50-Years.
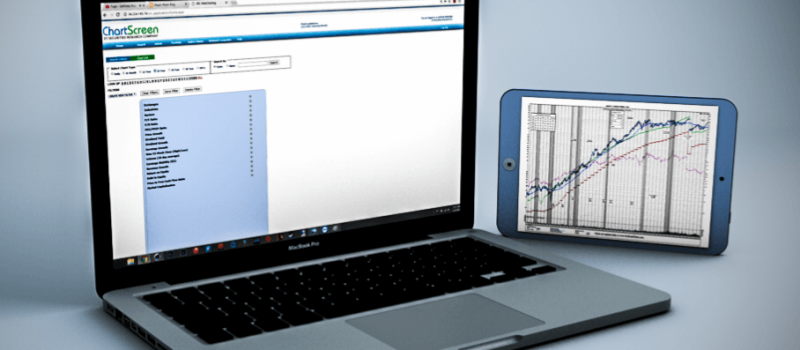
SRC's ChartScreen Premier Online Stock Research Service
Relied upon by investors for its search and filtering capabilities; breadth and depth of historical stock data; and its crystal clear, full-color presentation.
How to Read Stock Charts & Stock Chart Analysis
Stock chart analysis can be a vital tool for all investors. Their skillful use however, requires practice, and a great deal of judgment. Many people tend to think that someone who uses stock market chart analysis in his investment decisions must be a technician. A technician is often defined as someone who studies the phenomenon internal to the market – such as the patterns of price movement to forecast the future movement of the stock market as a whole, or of individual stocks.
The fundamentalist (briefly defined as one who bases his investment analysis and decisions primarily on basic factors, such as economic condition, supply and demand, labor, products, earnings and dividends) has just as much use for charts. The pictures they show and the amount of information they provide help to make the task of investment selection much easier. Our advice is don’t pay attention to these labels but learn to use and profit from stock charts. Click on the link or image below for your FREE Download: How to Use SRC Stock Chart Research to Profit in the Market.

