12-Year Charts for the Top 2 S&P 500 ETFs in 2017
Investopedia — Are you wondering if the S&P 500 is a good place to park your investment dollars? No less a sage than Warren Buffett says that the best retirement plan is to put 10% of your funds in short-term government bonds and 90% in an S&P 500 exchange-traded fund (ETF). As Buffet is one of the world’s foremost investors, you could do worse than to take his advice.
The S&P 500 is perhaps the best depiction of the U.S. economy, covering all the main sectors and representing roughly 80% of the nation’s market cap. It’s not surprising that some $7.8 trillion of investor cash is tied to the equities that make up the index – over $2 trillion of which is in index ETFs.
Of course, not all S&P 500 ETFs are created equal. Some do a much better job of replicating the benchmark, and others do so at enviably low costs compared to their competitors. You’ve found your investment sweet spot when you discover a fund that manages to do both equally well.
If you’re thinking of moving some cash into an S&P 500 index ETF, here’s a look at some top picks for 2017. Funds were chosen on the basis of a combination of year-to-date (YTD) performance, assets under management (AUM) and expense ratio. YTD performance figures reflect the period from Jan 1, 2017, through May 11, 2017. For comparison purposes, the YTD performance for the benchmark index during that period was 7.74%.
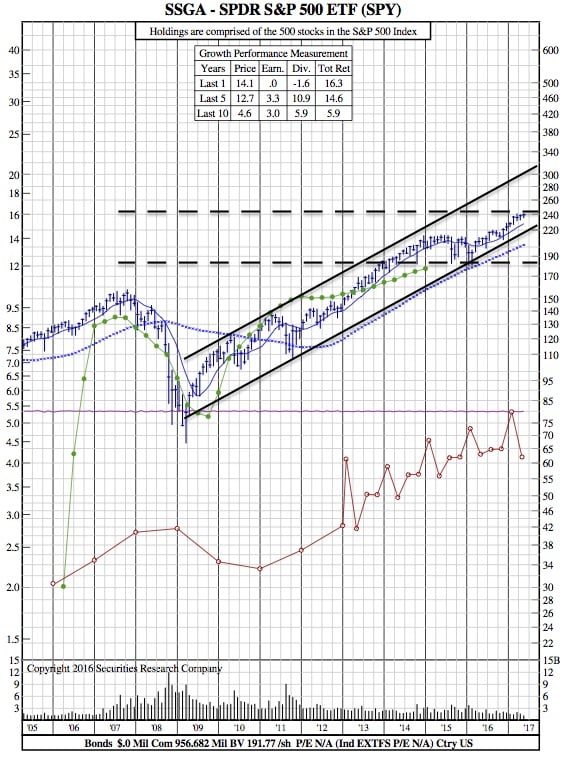
SPDR S&P 500 ETF (SPY)
AUM: $232 billion
YTD performance: 7.56%
Expense ratio: 0.09%
While technically not an ETF (SPY is a unit investment trust, which is typically more tax-efficient vehicles than managed funds), this is the oldest of the S&P 500 benchmarked funds and by far the largest in terms of AUM. It is also extraordinarily cheap to hold, with an expense ratio of just 9 basis points, and it very closely tracks the performance of the benchmark index.
The fund is also extremely liquid, with a trading volume in excess of $15 billion per day, which makes it attractive as a tactical trading instrument as well as a buy-and-hold investment for fleshing out a 401(k).
SPY 12-Year Chart:
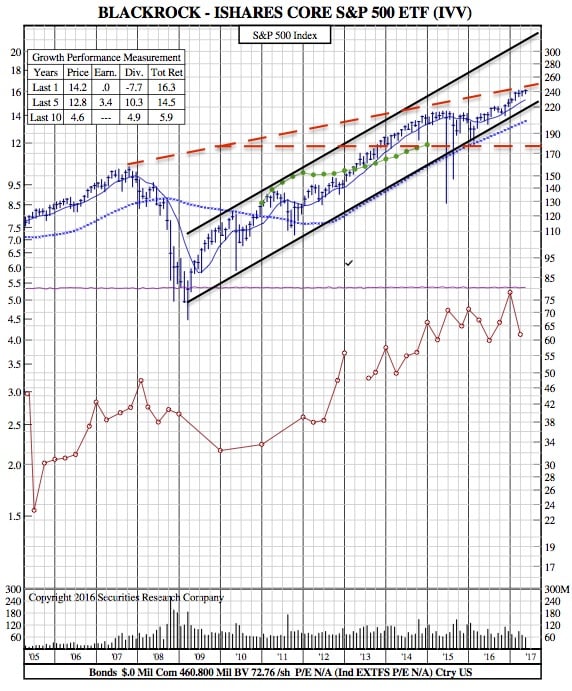
 iShares Core S&P 500 ETF (IVV)
Issuer: BlackRock, Inc. (BLK)
AUM: $111 billion
YTD performance: 7.56%
Expense Ratio: 0.04%
If you’re looking for straight-up S&P 500 exposure at rock-bottom prices, IVV is the fund for you. It’s difficult to find a fund that delivers tight benchmark performance with such low holding costs. Of course, it can’t come close to SPY in terms of volume, but IVV is plenty liquid for just about every class of investor, with over 3 million shares changing hands every day. It’s also a true ETF, which means it avoids the cash drag inherent in a unit investment trust like SPY. (See also: SEC Shines a Floodlight on ETFs.)
IVV 12-Year Chart:


