Going Back to 1990, Current Patterns in the Volatility Index say this is a Great Time to Buy (SPX 35-Year Chart)
CNBC — If investors have been sitting on the sidelines while the market rallies, then it may be high time to jump in, according to one technical analyst.
The CBOE Volatility index (STOXX: .VIX) recently hit its highest level of the year, just above 16, as global geopolitical concerns pressure the markets, sending the S&P 500 (INDEX: .SPX) sliding modestly toward the end of last week. This may signal a prime buying opportunity, according to Oppenheimer’s head of technical analysis, Ari Wald, who points to an intriguing relationship between the market’s moves and spikes in the VIX.
Historically, when the VIX spikes while the market is in an uptrend, above-average returns tend to be seen in stocks over the next three to six months, Wald said. He defines a VIX “spike” as a reading that is 50 percent higher than its three-month low; he marks the S&P 500 in an uptrend when it trades above its 200-day moving average.
“We think you have to use these market pullbacks to add to your exposure; we think the bull market is intact,” Wald said Monday in an interview on CNBC’s “Trading Nation.”
Since 1990, when this signal between the VIX and the market is triggered as it was last Thursday, the average gain over the next six months has been 8 percent, versus 4 percent for any six-month period.
“The numbers speak for itself; we think this pullback is an opportunity to buy,” Wald added Monday.
The volatility index often referred to as a measure of traders’ “fear” in the market and up 7 percent so far this year, recently did something that gives Susquehanna’s Stacey Gilbert pause about the market now.
The VIX last week went inverted; the front month’s reading of expected volatility is higher than the reading of the next two months’ expected volatility. In other words, traders are anticipating higher volatility in the near-term than they are in the long-term.
“That typically doesn’t happen; it’s very rare for it to happen. But when it does, and at the levels that we saw on Thursday, over the next 30 days the market typically is higher, let’s say on average around 2.3 percent higher,” Gilbert commented Monday on CNBC’s “Trading Nation.”
“So if things succeed and Trump gets through fiscal policy changes, you could have this notable upside pop over, let’s call it the next year to two years. And then the downside, obviously, it’s when everything doesn’t work out, or the geopolitical issues get crazier,” Gilbert said.
What is important for investors to consider is that this comes while the VIX is at relatively low levels, Gilbert said. She expects that the market will continue to vacillate in a pattern of “small pullbacks, little rallies, small pullbacks, little rallies,” until more information about expected tax policy reform comes from the Trump administration.
The S&P 500 was modestly lower in Tuesday trading as the VIX was higher around the 15 mark.
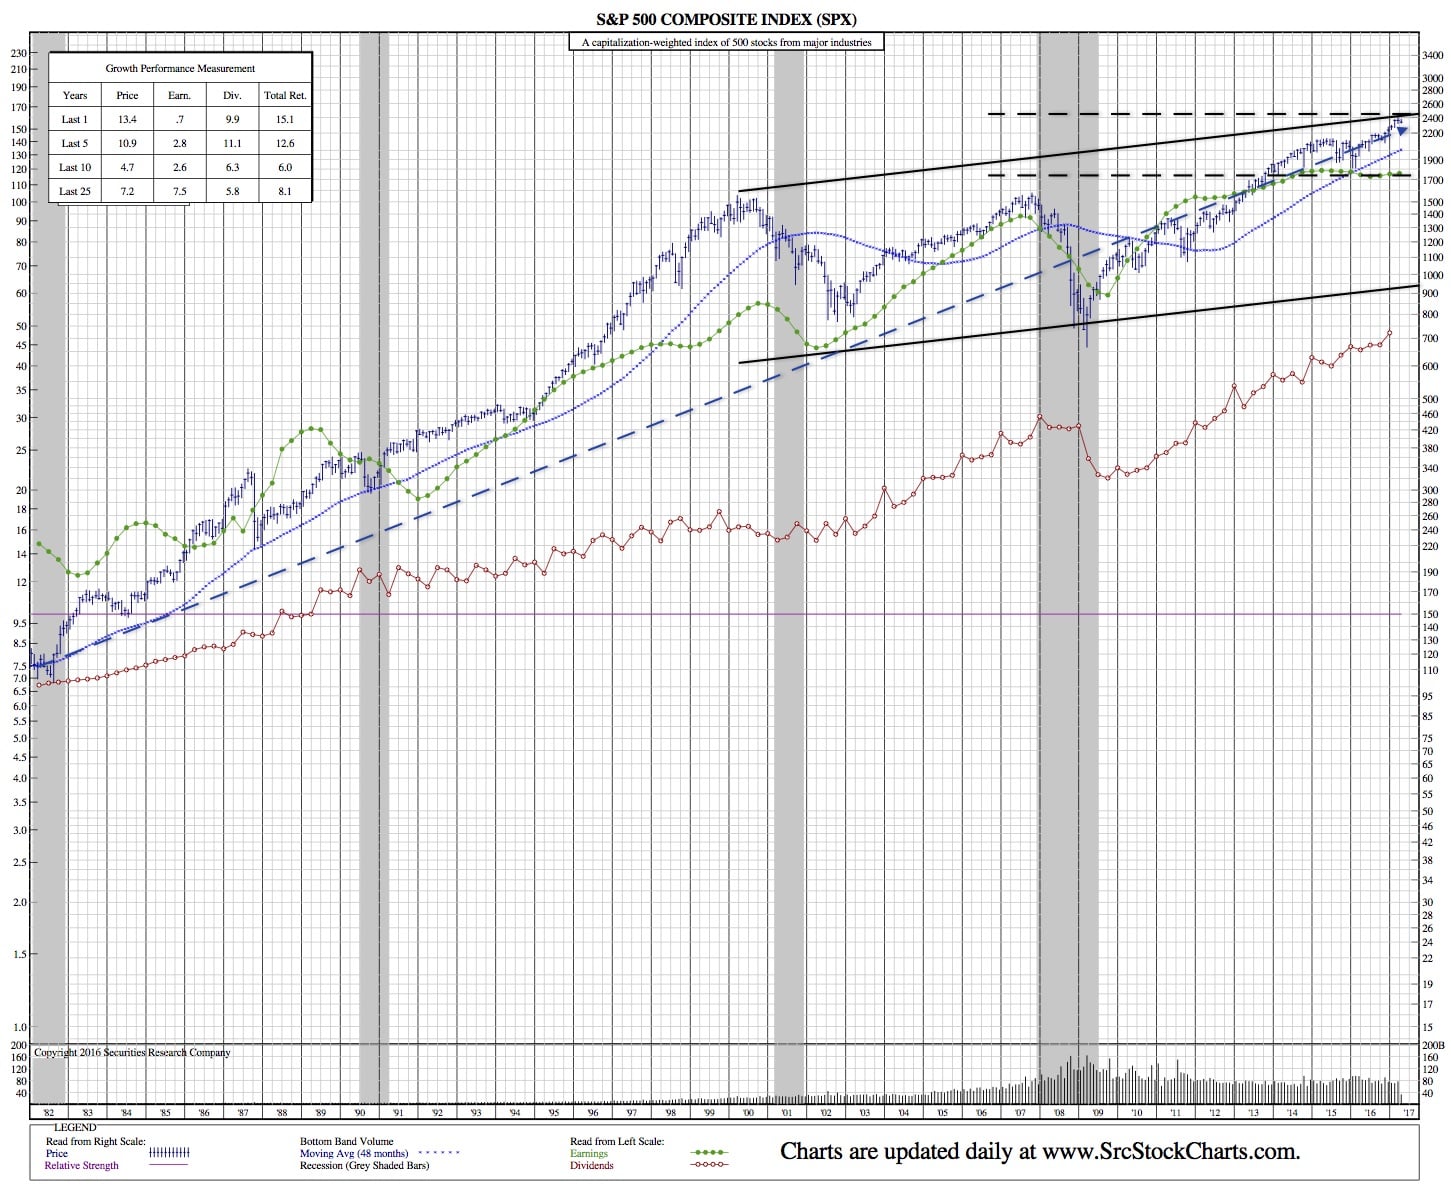
SPX 35-Year Chart:


